100 Days of Code, as a Tiny Experiment
"A PACT is a commitment to a specific action for a set period of time. Purposeful. Actionable. Continuous. Trackable." — Anne-Laure Le Cunff, Tiny Experiments[^1]
I've been reading Tiny Experiments, and one idea stuck.
Most of us set goals like "get good at X" or "build a habit." Then we fail, and we decide the problem is us. Le Cunff says the problem is usually the frame. Instead of a goal — a far-off finish line you either hit or miss — you make a PACT: a small, repeatable action you do every day for a set number of days, just to see what happens.
Not "become a better developer." Just: do the small thing, every day, and see what I learn.
So here's mine.
The PACT
I will commit code to my repo every day for 100 days.
Let's hold it up against the four letters:
- Purposeful. I want writing code — with Claude Code doing most of the typing — to be a daily reflex, not a when-I-feel-like-it thing.
- Actionable. I can do it today. No gear to buy, no course to finish first. Open the laptop, ship something small.
- Continuous. Every day. Small counts. One honest commit beats a heroic weekend and then nothing.
- Trackable. This is the part I love. There's already a perfect tracker built for it, and I don't have to maintain it by hand.
The tracker maintains itself
That green grid at the top of this post is my GitHub contribution chart, rendered live. Every day I commit, a square lights up. Miss a day, and there's a grey gap staring back at me.
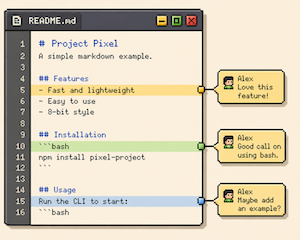
I didn't build it. I don't update it. It just tells the truth — which, if you've read my post on the TODO list nobody maintains, you'll know is exactly the kind of tracking I trust: the kind that runs without me.
That's the whole appeal of a PACT. It's not about willpower. It's about making the work visible and letting the chart do the nagging.
Why not a goal?
Because I've set the goal "code more" a dozen times and it means nothing. There's no day where I've done it. There's no square to fill.
A PACT is different. It doesn't ask did you succeed? It asks did you show up today? — a question I can answer with a yes or a no, every single day. And at the end of 100 days I won't have "become a better developer" (whatever that means). I'll have 100 squares, or I won't, and either way I'll have learned something about how I actually work.
That's the experiment. Not will I win — but what will I find out.
The book, one lesson at a time
I didn't just read Tiny Experiments once and shelve it. I loaded it into MarrowMinded, an app I built that sends me one lesson a day from books I've already read.
So now the book itself is a daily habit feeding a daily habit. Each morning I get one idea from it. Each day I make one commit. If you want to dig into the ideas in the book, that's where I keep them — one small piece at a time, instead of a 300-page block I'll forget in a week.
Takeaways
- Swap the goal for a PACT. Not "get good at X" but "do X, daily, for N days." A question you can answer every day beats a finish line you keep missing.
- Make it trackable by something that isn't you. The best tracker is the one you never have to maintain. Mine is a chart that updates itself.
- Small counts. One honest commit keeps the streak alive. The point is showing up, not the size of the day.
- Run it to learn, not to win. A tiny experiment doesn't ask did you succeed — it asks what did you find out.
Running your own tiny experiment? I'd love to hear what your PACT is — and whether the chart nags you as much as mine nags me.
[^1]: Anne-Laure Le Cunff, Tiny Experiments (2025). The PACT framework comes from her work at Ness Labs.